
Power BI, a leading business intelligence tool developed by Microsoft, has emerged as a game-changer in the realm of COVID-19 data analysis. With its robust capabilities for data visualization, exploration, and collaboration, Power BI enables researchers, public health officials, and policymakers to gain real-time insights into the evolving dynamics of the pandemic, ultimately supporting informed decision-making and effective response strategies.
One of the key strengths of Power BI in COVID-19 data analysis is its ability to connect and integrate data from a wide range of sources, including public health databases, hospital records, demographic information, and geographic data. By consolidating disparate datasets into a unified platform, Power BI allows users to conduct comprehensive analyses, identify correlations, and uncover trends that inform our understanding of the spread and impact of the virus.
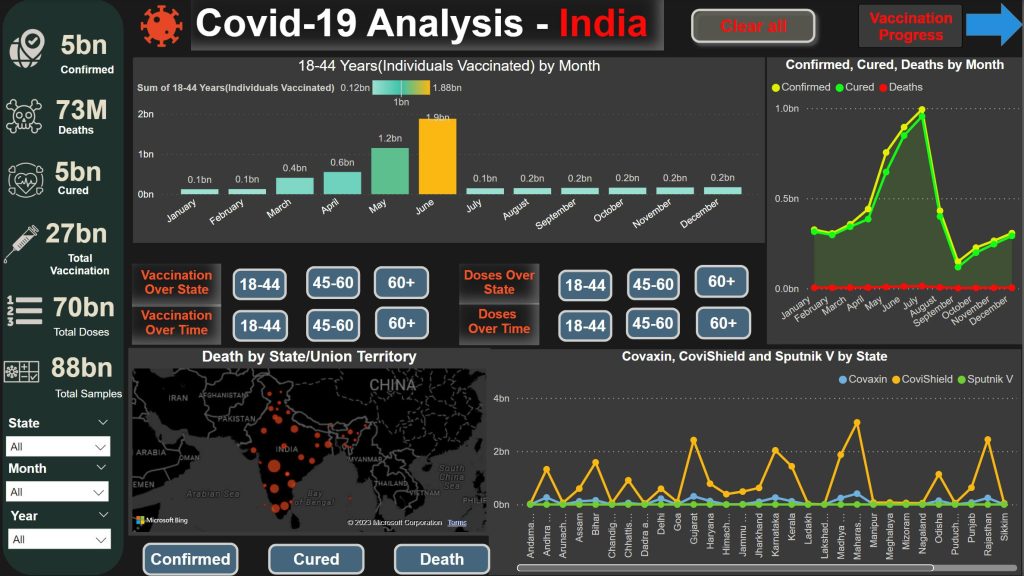
Furthermore, Power BI’s interactive dashboard and report-building capabilities provide users with a dynamic and customizable interface for exploring and visualizing COVID-19 data. With features such as drill-down functionality, filtering options, and real-time data refresh, users can delve deeper into the data, extract actionable insights, and track key metrics such as case counts, testing rates, and vaccination progress with precision and clarity.
Moreover, Power BI’s collaboration features enable multidisciplinary teams to work together on analyzing COVID-19 data, sharing insights, and creating reports that inform decision-making at various levels. By facilitating data sharing, version control, and secure data access, Power BI promotes transparency and accountability in the response to the pandemic, fostering a data-driven approach that enhances coordination and efficiency in public health efforts.